Hello, this week I finally paid the bill from devlog #1. Back then I bet the game on single-threaded JavaScript and wrote “this will hurt later” like a man signing a loan. Later arrived. To find out exactly how much it hurt, I built a Playwright harness in a separate repo that drives the dev build with real clicks, records the browser’s event-timing entries and long tasks for each one, and reports the median across repeated runs, because a number you measured once while the profiler happened to be attached is a rumor. The median said: clicking the Engage button took 226 ms before anything visible happened. For a game that is mostly menus, the menu being slow is the whole game being slow.
I memoized the markers and saved 4 ms
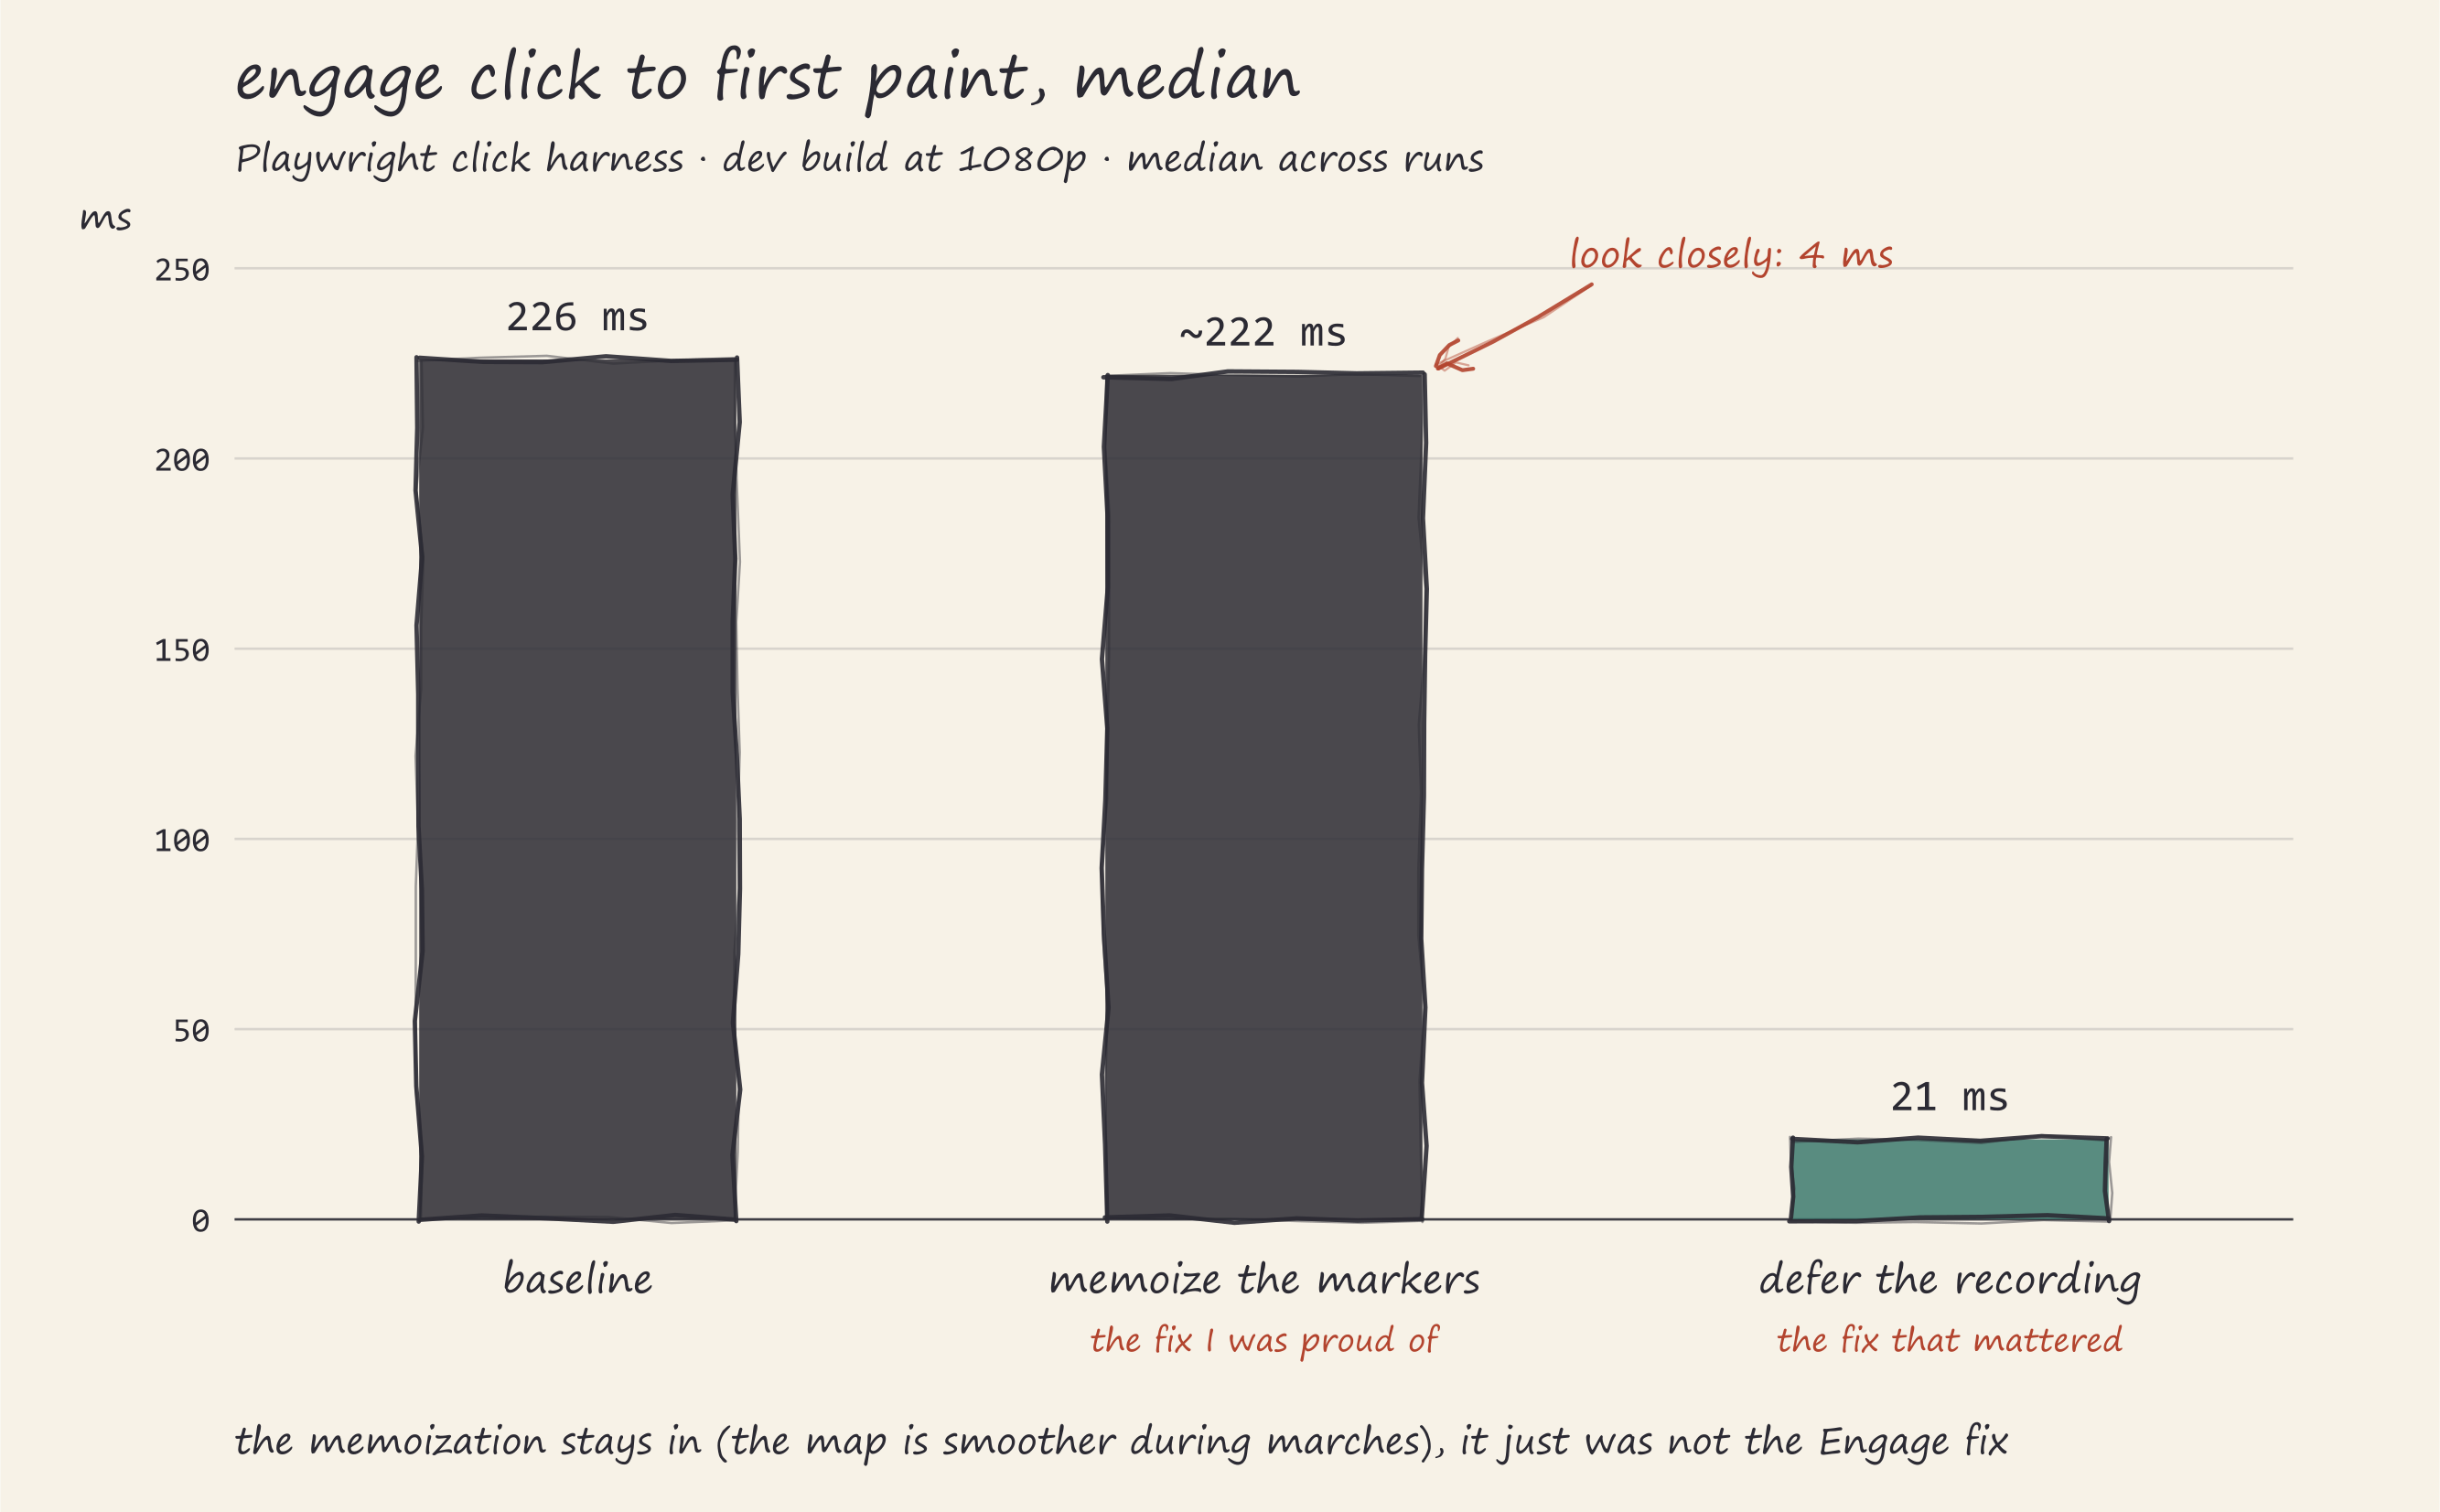
Engage lives on the region map, and the region map draws around 90 site markers, each with a tooltip, a fog state, and assorted pin decorations. When I stared at the React tree, the markers looked expensive. Ninety components re-rendering on every store change, obviously that is the problem, any senior engineer can see it from across the room.
So I wrapped SiteMarker in memo, hoisted the marker list into its own useMemo so per-mousemove hover state stops re-rendering ~60 tooltips, and re-ran the harness, already composing the victory paragraph in my head. The click went from 226 ms to roughly 222 ms.
Four milliseconds. The memoization is real and it stays in (src/ui/features/regionMap/RegionMapScreen.tsx still carries it, and the map is smoother during marches for it), but as an Engage fix it was a rounding error. I had guessed instead of measured, and I had guessed at the part of the codebase I find pleasant to think about.
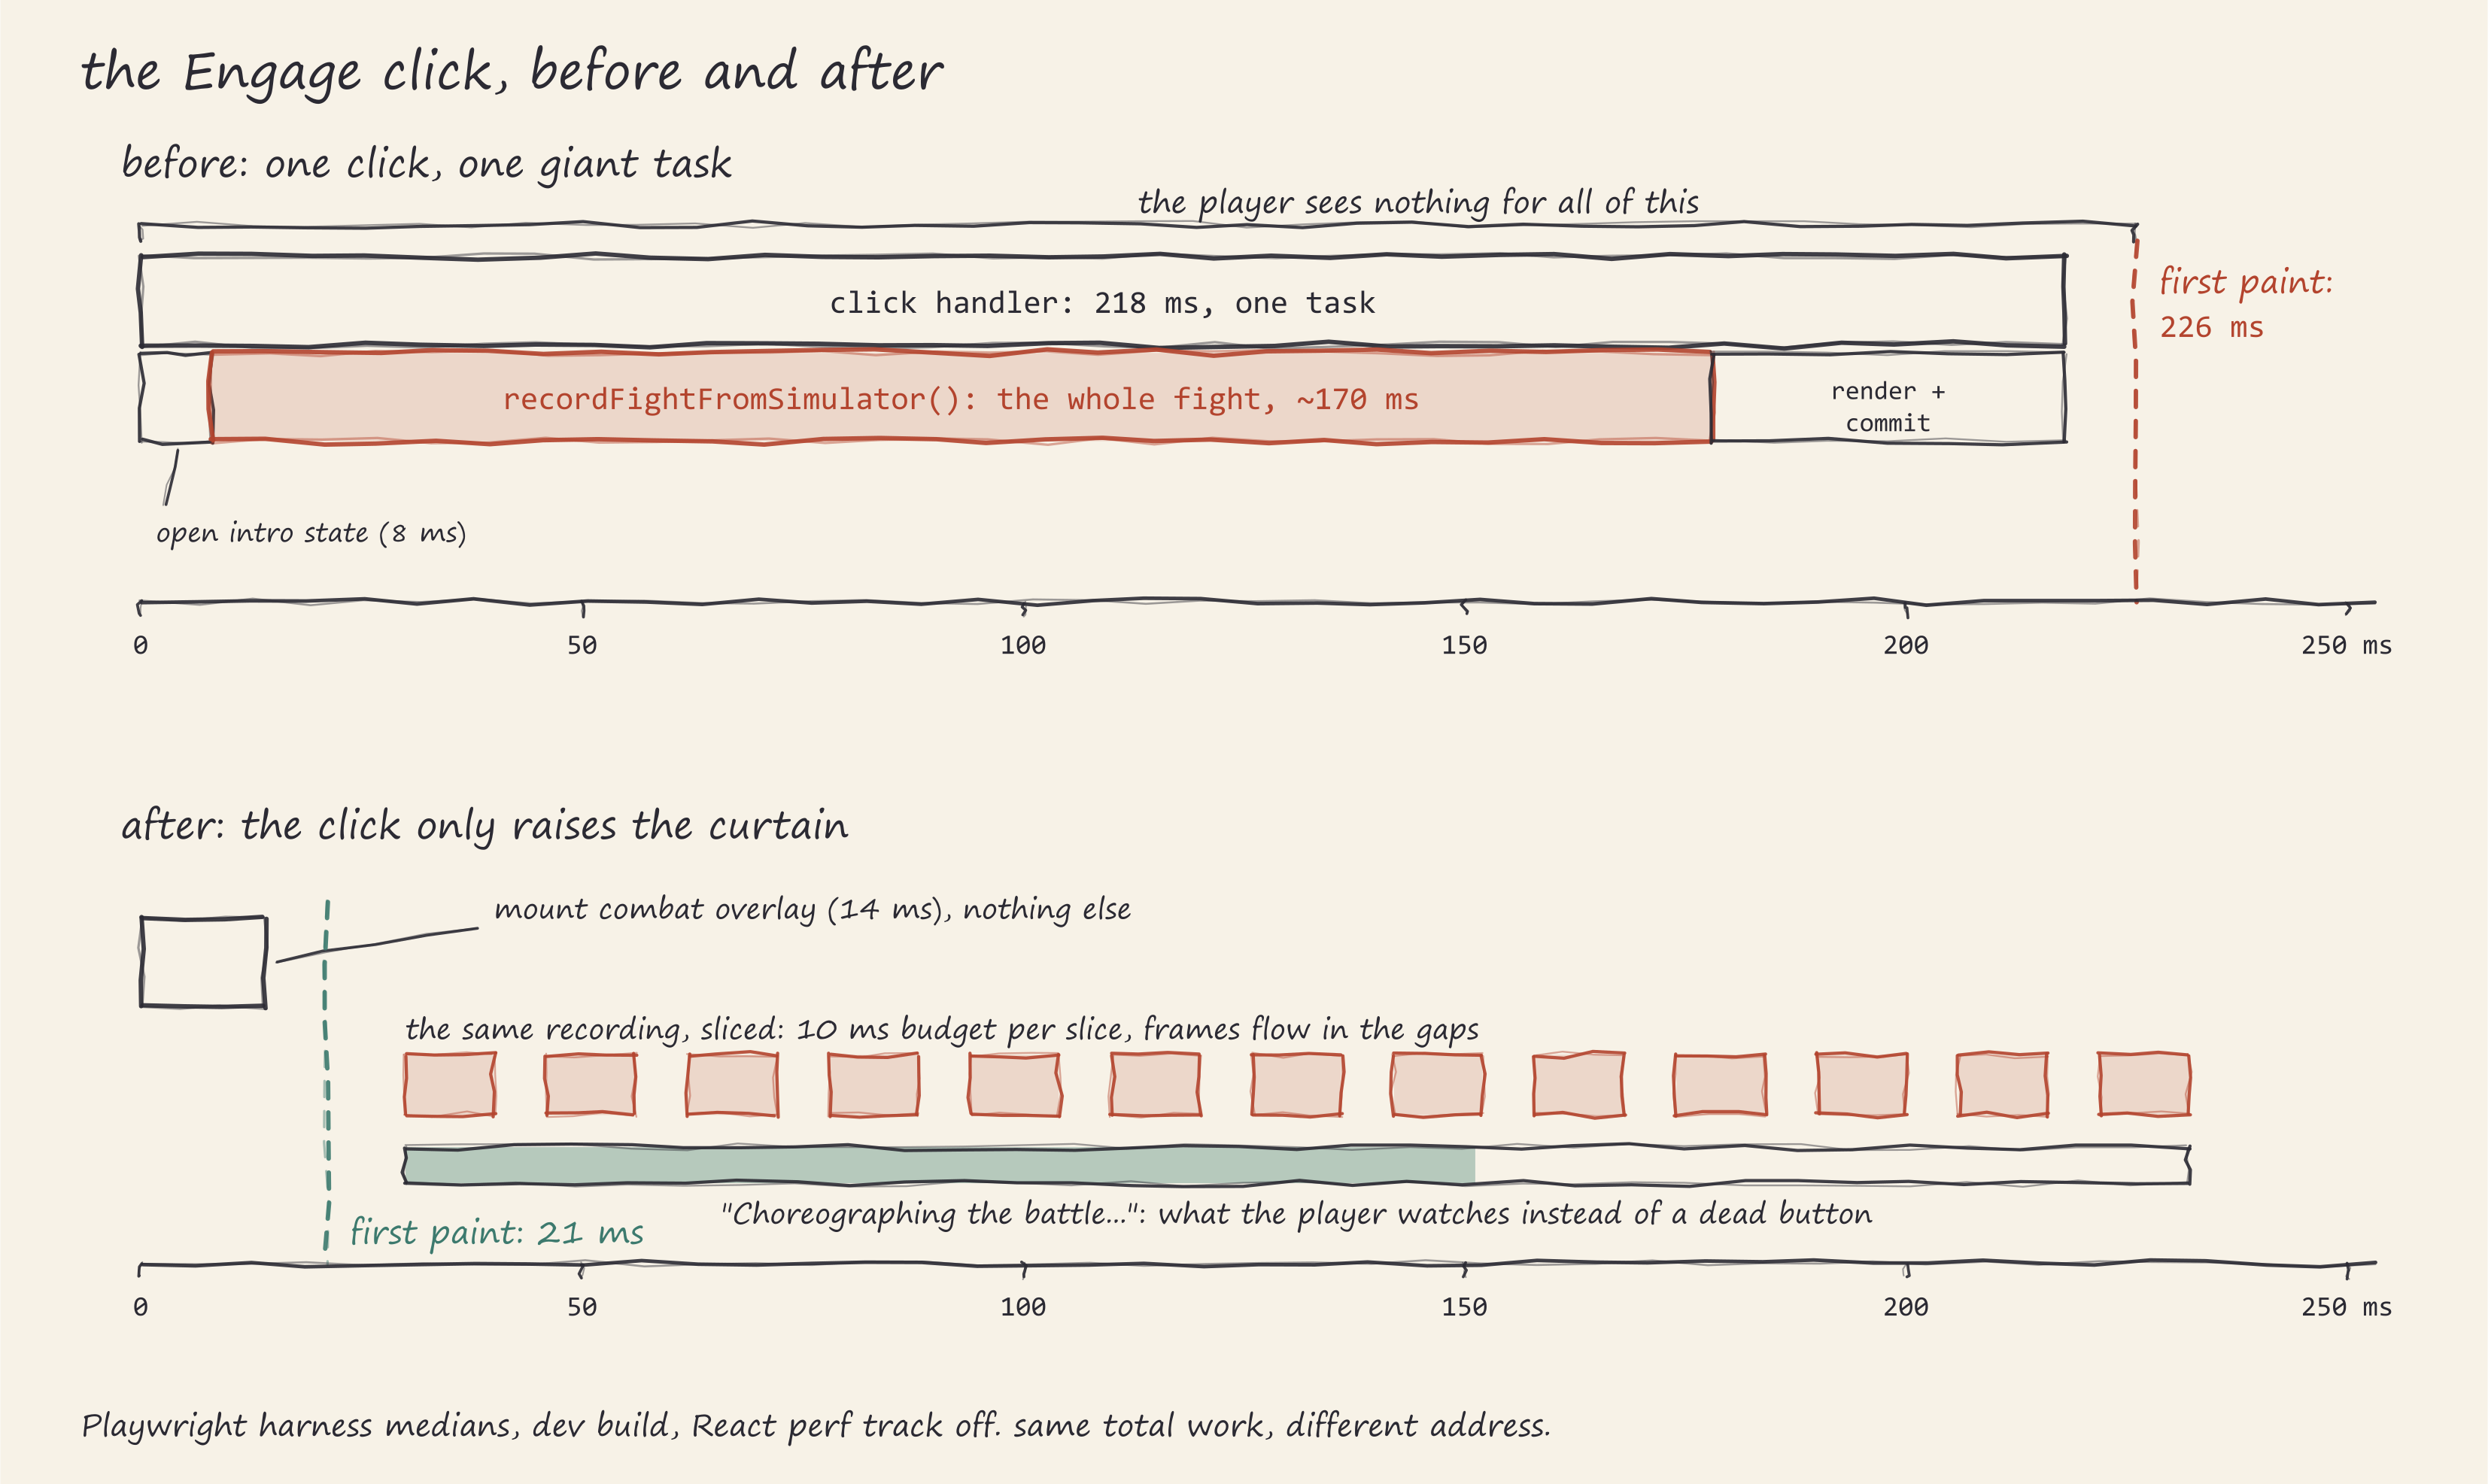
The profiler was less polite. The flame graph for the click was one enormous block, about 170 of the 226 ms, and it was not rendering anything. It was recordFightFromSimulator. Devlog #4 explained the architecture: when you start a fight, Mutarch simulates the entire battle up front and the arena plays the recording back. What #4 did not mention, because I had not noticed yet, was where that simulation ran: synchronously, inside the click handler, before the battle intro had rendered a single frame. The player clicks Engage and the main thread goes away to fight the whole war before agreeing to show a button press.
Three fixes, one of which mattered
The real work was moving things out of the click’s critical path, in three steps.
Defer the recording past first paint. The engage click now only mounts the combat overlay. The recording is scheduled one task after the next paint and runs through an incremental recorder in time slices with a wall-clock budget of 10 ms each (RECORDING_SLICE_BUDGET_MS in src/store/combatStore.ts), yielding between slices so frames keep flowing. While it runs, the fight holds at tick 0 and the panel shows a progress bar labeled “Choreographing the battle”, fed by recorded ticks over the tick cap. The full record still costs in the order of 100 to 300 ms of CPU depending on fight size; the difference is that the player now spends that time watching an intro screen instead of a dead button. If recording fails, the fight falls back to the live-stepped simulator, same as before. This one fix took the harness median from 226 ms to 21 ms. Those two numbers are the recorded measurements from the harness repo on my dev machine, dev build at 1080p; your hardware will move them, the ratio should survive.
Hoist the intro host. The VS intro used to live inside the expedition screen, which meant showing it required mounting the expedition screen, a heavy component tree the player did not ask for and would not see. The intro host now sits in src/ui/app/AppShell.tsx, above all screens, so the VS overlay pops directly over the region map. The expedition machinery stays unmounted until the fight actually needs it.
Warm up the lazy chunks. The combat screens are lazy-loaded, so the very first fight of a session used to pay the dynamic-import tax inside the click. AppShell now preloads the intro and arena chunks during idle time after the boot frame settles, via requestIdleCallback with an 8000 ms timeout (and a plain 3000 ms setTimeout fallback). The synchronous boot path stays lean; the chunks are simply warm by the time anyone clicks.
Side note: you might ask why a 2D pixel-art game cares about 200 ms at all. Two reasons. First, the Factorio argument: people see pixel art and expect it to run on a potato, and they are right to. A 3D game gets latency forgiveness from its looks; a 2D game gets none. Second, Mutarch is a menu-driven game, and in a menu-driven game snappiness is the aesthetic. The combat looks the same at 21 ms and 226 ms. The game only feels different, which is to say, entirely different.
Four canvases and a haunted profiler
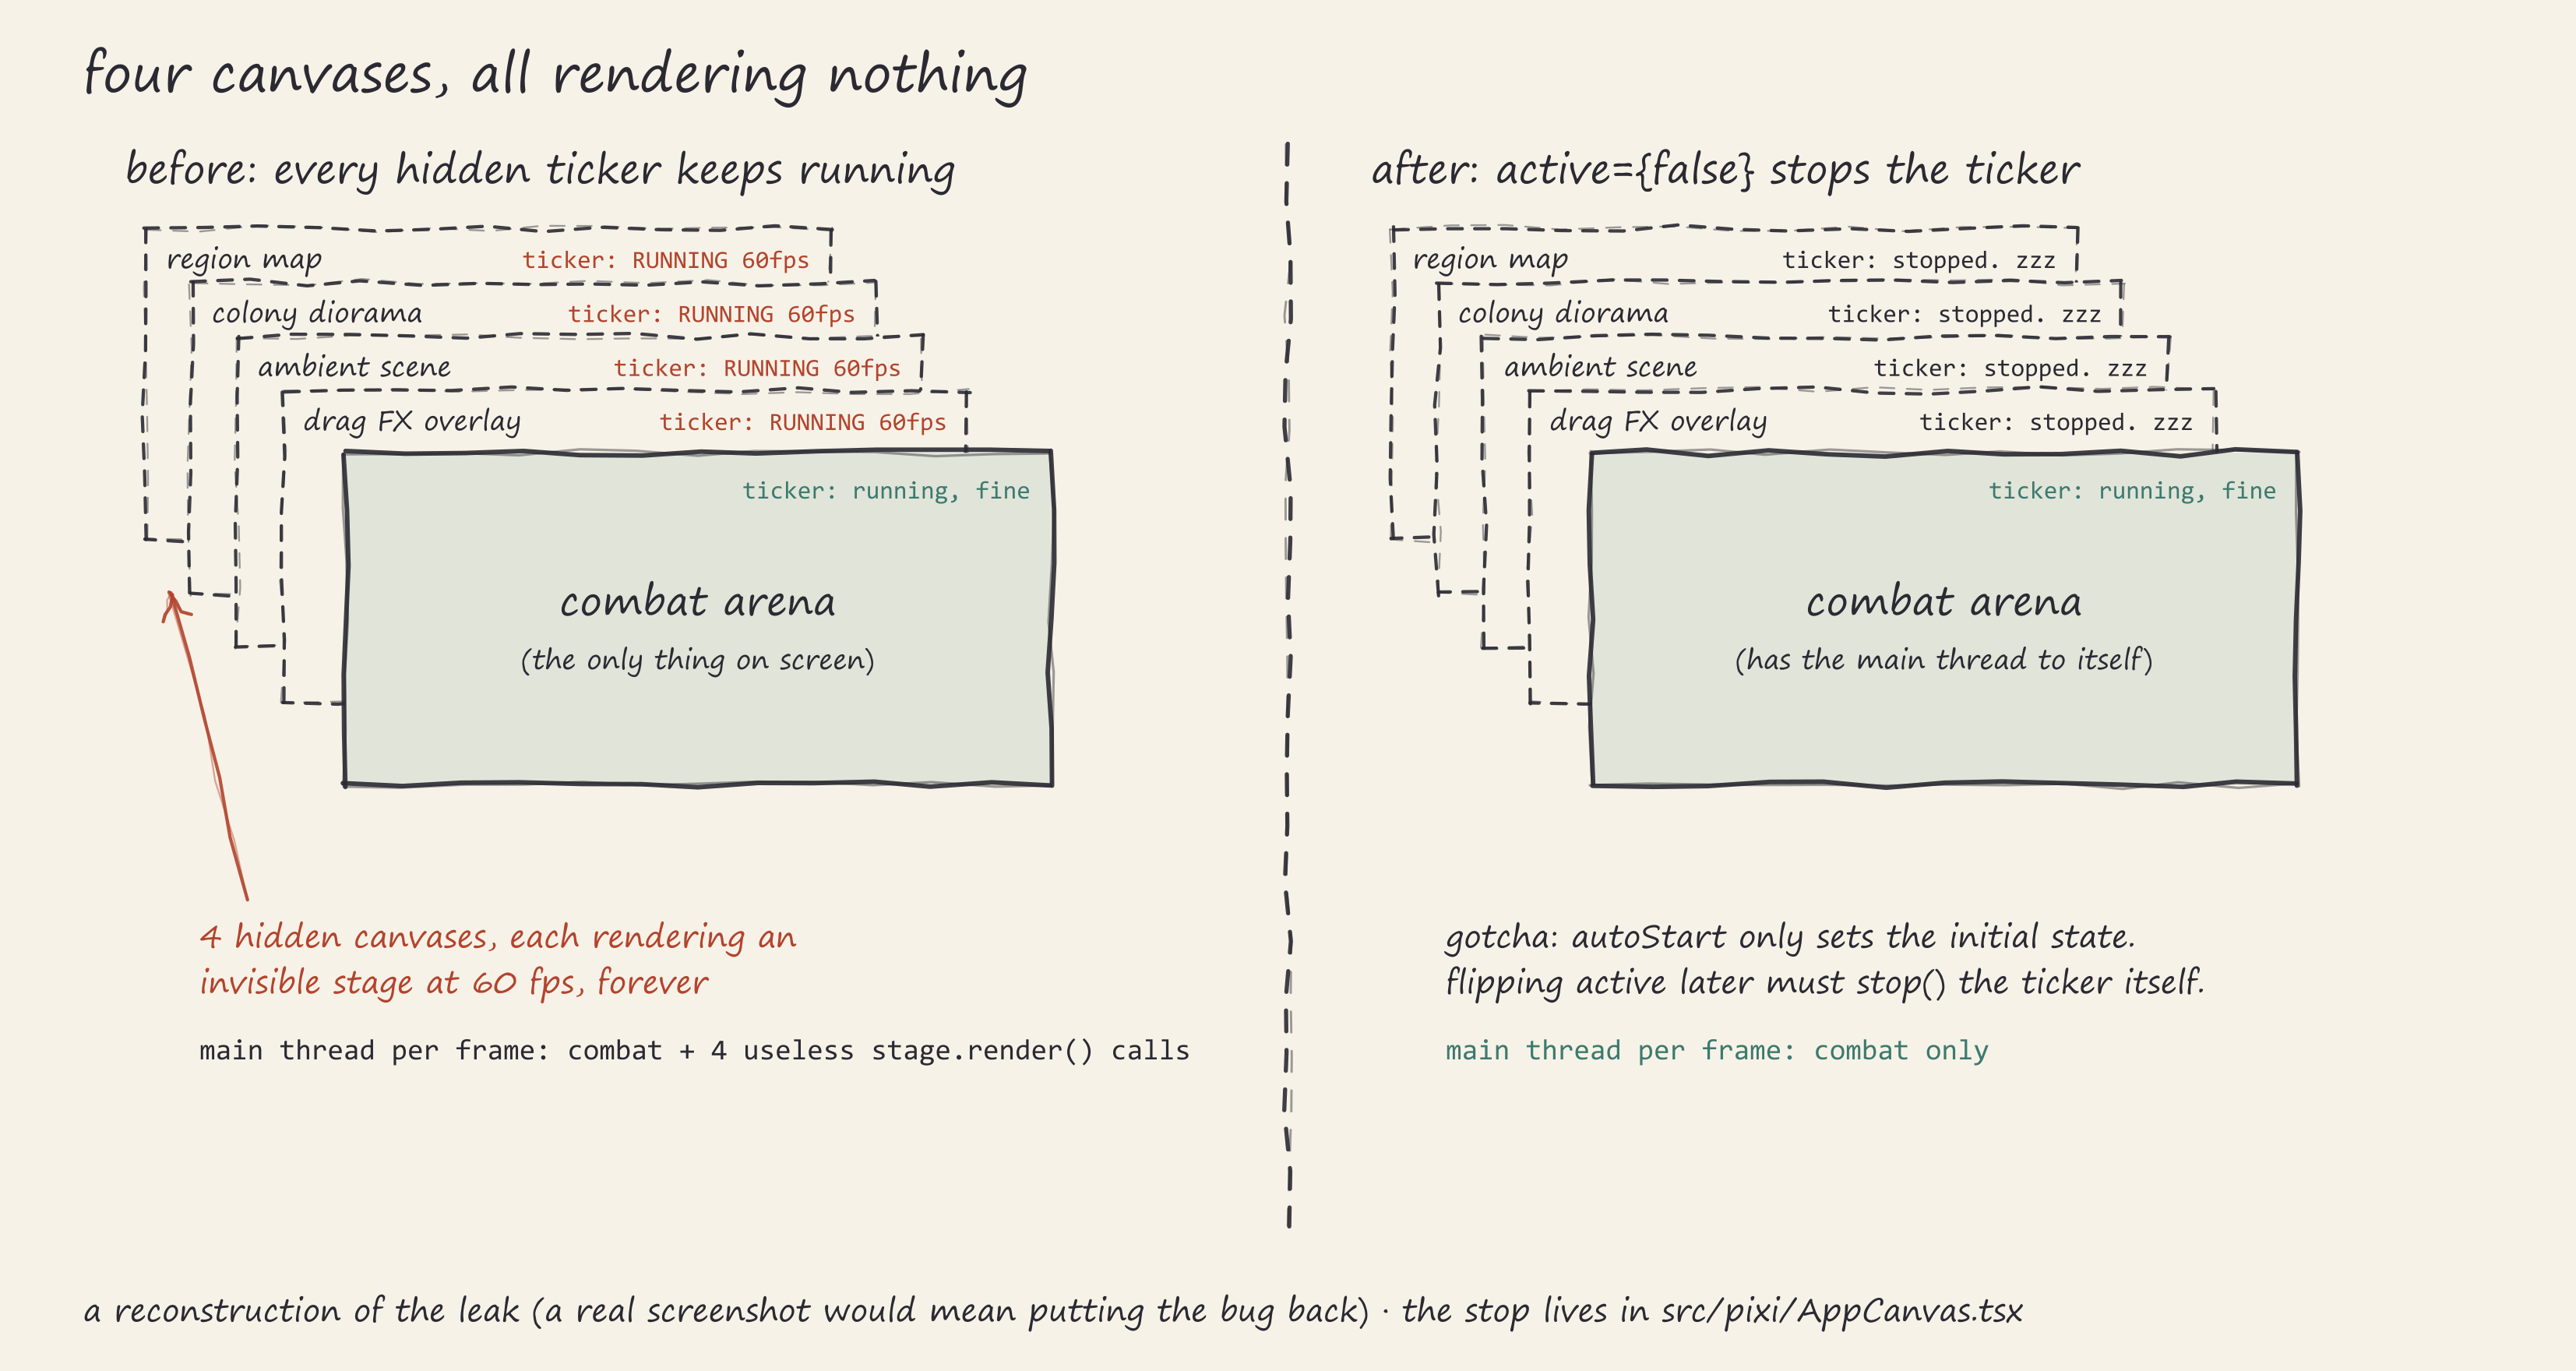
With the click fixed, the harness still showed combat frames competing with something. The something turned out to be every Pixi canvas I had ever mounted. The colony diorama, the ambient scenes, the map: four hidden canvases, each politely rendering its stage at 60 fps behind whatever screen was actually visible, because a Pixi Application ticker does not care whether anyone can see it.
The fix is an active prop on the shared AppCanvas wrapper (src/pixi/AppCanvas.tsx). The subtlety is that Pixi’s autoStart only governs the initial state, so flipping active later has to stop and start the ticker itself, and an async-initializing canvas can finish init after active has already flipped off, so the init handler re-checks through a ref. With that in place, a hidden canvas costs nothing and combat has the main thread to itself.
Then the haunting. All through this work, dev-build clicks were mysteriously, inconsistently terrible, sometimes by seconds. The culprit was React 19’s dev-only Component Performance Track: when enabled, every re-rendered component whose props object changed identity gets a deep prev/next props walk and a performance.measure whose detail payload is structured-cloned. Mutarch screens pass large object graphs as props (expedition nodes, the world, champion outcomes), so single commits could burn seconds inside React’s own instrumentation. A probe measured one champion-execution click at ~9.4 s with the track on and ~130 ms with it off. The kill switch is src/devReactPerfTrackOff.ts, which deletes console.timeStamp before react-dom initializes, and it must stay the first import in src/main.tsx or it does nothing.
Full disclosure: this is a dev-build-only problem, shipped builds never had it, and it means every dev-build measurement I took before finding it was contaminated to some unknown degree. The 226 and 21 ms figures above were re-measured with the track off. The trade is that React’s component tracks vanish from the Chrome profiler in dev; when I need them, I comment out one line and accept the molasses.
Small things
- Identical UI sounds fired within 40 ms now coalesce into one play (
MIN_REPLAY_GAP_MSinsrc/ui/audio/uiSfx.ts). Sorting five items into the backpack used to stack five copies of the coin sound into one harsh transient; now it is one coin, which is what your ear thought it heard anyway. - Combat audio is capped at 24 simultaneous voices with at most 3 instances of the same source (
COMBAT_SFX_MAX_VOICES,COMBAT_SFX_MAX_INSTANCES_PER_SRC). Past the cap, a priority ladder decides who gets a voice: damage hits at 30, skills at 50, crits at 70, boss phase beats at 85, critical cues at 90. A big melee no longer sounds like a bag of cutlery falling down stairs. - Damage sounds coalesce per bucket (crit, physical, magic) with at most 4 plays per burst (
DAMAGE_COALESCE_MAX_PLAYS), so an area skill hitting twelve units reads as one impact with weight instead of twelve overlapping slaps. - All UI sound buffers are decoded up front at boot (
preloadUiSfx), so the first click of a session no longer pays a fetch-and-decode delay before its own sound effect.
As always, let me know what you think.